By Tom Hudson
Probably every ATARI user who has ever dabbled in the graphics area has encountered the infamous "ERROR 141 - CURSOR OUT OF RANGE". This error message occurs when you try to PLOT or DRAWTO a point which is off the screen. The following program demonstrates a subroutine which may be used to eliminate this problem, while drawing the portion of the line that is off the screen:
The following program allows you to:
1. Define any shape (closed polygon)
2. Draw it to the screen in any scale
3. Rotate the object around a specified point
Type in the program and RUN it. You will see a square appear. It will begin rotating and increase in size until its' corners run completely off the screen, and it disappears altogether. Since the program is in an infinite loop, it is necessary to press the BREAK key to terminate execution.
HOW IT WORKS
| LINE# |
FUNCTION |
| 50 | This line sets the size increment to 1.1.
This means that each time the object is drawn, it will be 1. 1 times the size of the previous plot. If SI is 1, the shape will stay the same size. If SI is.5 it will shrink to half its size each time it is drawn. |
| 60 |
This line establishes the initial size of the shape. Since SF is 0.5, the object will start out as half as big as defined. |
| 70 | This line sets the rotation factor, the num ber of degrees to rotate the shape each time it is drawn. |
| 80 | This line sets CX and CY, the coordinates where the object will be drawn on the screen. In this case, the object will be drawn at 80, 48, the center of the GRAPHICS 6 screen. |
| 90 | This line tells the clipping routine what the screen limits are. Since we are using GRAPHICS 6, (160x96), XL (X left)=0, XR (X right)=159, YT (Y top)=0, and YB (Y bottom)=95. If we were using GRAPHICS 5, the values would be XL=0, XR=79, YT=0, YB=47. By changing this statement, the clipping rou tine may be used for any screen resolution. |
| 100-120 | These lines read the data about the shape and scale it. The data statement is in line 450. |
| 130-170 | These lines perform the rotation function, The rotated points are moved to the X2 and Y2 arrays. |
| 180 | This line clears the screen for the next
plot. (If this line were removed, some in
teresting patterns can be created). |
| 200-210 | These lines go through the shape data and send two points at a time to the clipping routine (lines 230-440). X1 and XY1 are the coordinates of the second point. These two points are the endpoints of the line to be analyzed by the clipping routine. The clipping routine determines if the line is on the screen and draws it. |
| 230-440 | This is the clipping routine. It accepts the two endpoints of a line (X1, Y1, and X2, Y2) -and draws the visible portion of it on the screen. Since this routine is complicated, I will not give an in-depth explanation of it at this time. |
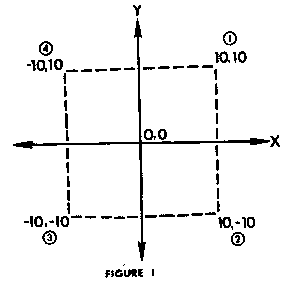
| 450 | This line contains the data describing the
shape. The first number is the number of
points in the shape. Since this is a square
in this test program, there are 4 points.
The next 8 numbers are the coordinates
for the 4 points (refer to figure 1). Figure
1
is an X-Y coordinate grid which is helpful
in designing a shape (ie. the charts in Issue
#1, pgs. 30, 31). The shape rotates
around the intersection of the X and Y
axes (0,0) which in this case is the center
of the n square. You can set up any shape
you want by merely changing this DATA
statement. Once again, the form is: DATA n,X1,Y1,X2,Y2,...Xn,Yn where n is the number of points in the shape. |

This program is highly flexible, and can be used to manipulate any number of shapes. By changing lines 50,60, 70,80, and 450 you can make any shape any size, any rotational position, and draw it anywhere