One of
the Atari's greatest assets is its ability to display beautiful color graphics.
We have all seen graphics put to use in games such as Star Raiders and other
entertainment programs, but one of the best uses of color graphics is the
display of information in a form which can be easily interpreted. Atari has
recently introduced GRAPH-IT, an advanced graphics package, for this very
purpose.
GRAPH-IT
is a set of programs which allow the easy generation of bar charts, pie graphs,
twodimension X,Y plots, twodimension polar plots and three-dimension X,Y,Z
plots. The package requires a minimum of 16K memory, the BASIC cartridge and a
410 recorder. An optional accessory is a joystick, which is not used for
drawing, but allows the user to determine the slope of a line at a particular
point on the screen.
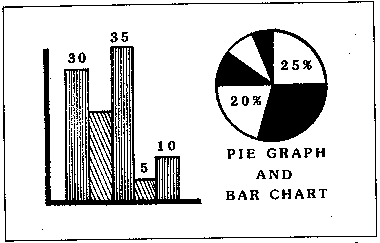
The bar
chart program is relatively straightforward. Users have the ability to display
up to three sets of data at once, with titles and column labels (such as JAN,
FEB, MAR, etc.). Users may have up to 32 such columns on the screen at once, or
as few as one. After giving the title and column labels, the data is entered.
All entries are nicely prompted by the computer and edited to make sure the user
didn't type in any letters by mistake. After all the data values have been
entered, the computer generates the chart, scaling it so that it fits properly
on the screen.
The pie
graph program is also straightforward, allowing the user to generate a pie graph
with up to 12 "slices". Each slice can have a three-letter label.
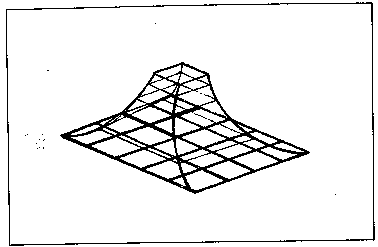
Next are
the two- and three-dimension plot programs. These programs use high-resolution
graphics modes to draw fine-lined graphs of complex mathematical functions. The
ability to draw these functions in a graphic form is very important when trying
to find correlations between several variables. In addition, it sometimes is
necessary to know the slope at certain points on such a plot. Fortunately, these
programs will allow the user to use a joystick controller to determine the slope
(and other information)
of a line on the graph. The user simply moves a cursor around on the screen with
the stick, and when the desired point is located, the button is pressed. Since
these programs are written in BASIC, users may use any function available in
BASIC within their function (such as SQR, SIN, COS, etc.). This is an excellent
feature, especially since the user can type functions into the program like any
other input. The program also allows the user to go back and edit the function
if it is incorrect. The amazing flexibility of this part of the GRAPH-IT package
(including automatic scaling of the plot) is nice to see in a world of mediocre
programs.
The
GRAPH-IT package comes with a 15-page manual packed with color illustrations and
hints on using graphic displays to their best advantage. This manual is typical
of Atari's high quality documentation.
In
reviewing GRAPH-IT, this reviewer has only a few small gripes with the package.
First, the user has no choice in the colors that are used for the bar charts and
pie graphs. This is no great problem, but such a feature would be nice. Second,
since the programs are supplied on cassette, there are no provisions to use data
files from disk, which necessitates typing in data each time a graph is
generated. For most applications, this would not make such a difference. Third,
and probably the most important, the program is written in BASIC, which can be
terribly slow. The only time this becomes a factor is when the program is
generating complicated three-dimensional plots. Some can take several hours if
the functions are highly complicated. It makes one wonder why the package was
not written in machine language instead of BASIC. Of course, even 'with the
wait, it's faster than doing all those calculations by hand!
In
conclusion, the Atari GRAPH-IT graphics package is an excellent way to present
data in an easyto-understand form, with the computer doing all the hard work.
And isn't that what computers are for, anyway?