I have always been fascinated by a computer's ability to take a flat grid and literally bend and distort it. I've seen various pictures produced by the Atari - hats and spirals made simply by a formula. However, altering these programs for personal use and experimentation is both difficult and time consuming.
After studylg calculus and graphics in my first semester of college, I resolved to make a program to allow anyone to produce quick, fascinating pictures on Atari's superior high-resolution mode (graphics 24).
With Z-Plotter, all you have to do (besides typing in the program) is enter a formula in terms of the X and Y during the run, Atari's forced read mode (utilized with location 842) will install the formula in all the appropriate line numbers.
There are no loops, IF/THENs, or special circumstances to enter for each formula. This program simply won't graph out of specified domains, which prevents errors. If you wish, Z-Plotter will scale the Z-axis, so that the function won't even extend beyond the bounds.
Once you've saved your copy to disk, simply type RUN, and the program will prepare itself, filling two machine language routines (49 Second Screen Dump and a text-superimposing routine).
Next, it will inquire for a function. A short set of directions is also displayed, to guide you. Simply type the Z= fuction in terms of X and/or Y. Several sample formulas are given at the end of this article. Z-Plotter will then resume control and ask you for the following inputs.
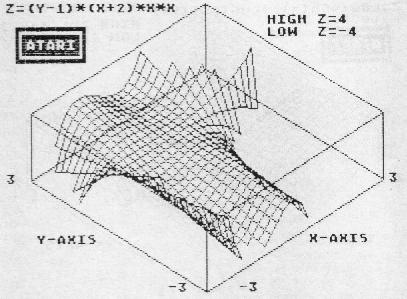
You are asked to choose between automatic scaling and manual scaling of the Z-axis. Automatic scaling will determine the maximum and minimum Z values for the function in the intervals specified. Although it's very tempting to be lazy and just select the autoscaling feature, you will find that many functions are far more stimulating and exciting when they are graphed in part.
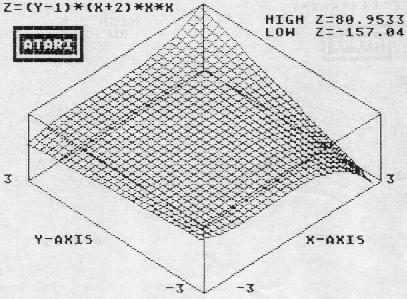
The autoscale will force a function to be squeezed into the isometric box drawn on the screen. If you select manual scaling, you'll be asked to enter the lowest and highest points on the Z-axis to be displayd. The graph will not be plotted outside of the Z-axis range. Note: when manual scaling, the limits must be set so that the point Z=0 is either on or between the upper and lower bounds. Examples of acceptable limits: Z lower =-2, Z upper =2 or Z lower =0, Z upper =3.
X/Y lower limit: this will be the leftmost point on the X-axis, and the number also serves as the lowest point for the Y-axis.
X/Y Upper limit: opposite of above. Note: just as with the Z-axis, Y=0 and X=0 must be within or on the box. Picture a perfect square; the Y-axis will have the same length as the X-axis has width.
Desired resolution (1= high, 10 =low): I use 4 for most graphs. It's a good balance between BASIC's speed and peformance resolution. Note: odd numbers may cause problems if your formula is undefined somewhere in the box.
The next input can be surpassed by just pressing RETURN. Here, you're asked for the eight-character name that can be used if you wish to save to disk (in Magniprint format) the screen, once it has been displayed.
That's all! Z-Plotter can let almost anyone dream up equations to dazzle the computer screen. When it's finished, it will sound off, telling you that you can now render the following options!
(1) OPTION - adds borders (the isometric box) and labels superimposed over the graphics screen for an impressive technical display.
(2) SELECT - saves the picture as a data file that can be redisplayed with the program Magniprint by Alpha Systems. The lines used to perform this duty are provided by Magniprint for use in all BASIC programs. By the way, Magniprint can then print out these pictures - in several sizes and in varied formats.
(3) START - 49 Second Screen Dump! This will print the screen out right then and there for the Epson MX-80 printer with Graphtrax 80 (works perfectly with my Gemini 1OX). This routine was provided by COMPUTE!'s Second Book of Atari.
(4) ESC - will erase the screen and rerun the program without going through initialization again.
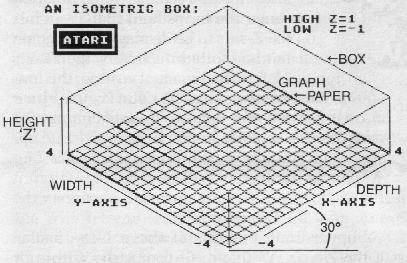
Imagine a sheet of square graph paper lying perfectly flat on a table top. One side, say the depth, is the X-axis. The height is the Y-axis, but we'll call it the width, instead.
If we raised a line perpendicular to each corner of our graph paper to a certain height, called Z, and joined the top of the lines to each other, we would create a box. If Z=Y=X, then we have a cube, with our graph paper as the bottom.
Let's look at this box from the top. You see the grid and recognize the pattern as a typical coordinate plane (X,Y). If we look at the box perpendicular to the X-axis, we see X, the depth, and Z, the height. The Y-axis is just a point at the left lower corner.
Looking perpendicular to the Y-axis, the X-axis would look like a point in the lower right corner. If X=Y, and you look at this corner so that both the X- and Y-axes appear to be the same length, you would see a 90 degree corner facing away from you.
Now, raise your eye straight up above the table. Our graph paper looks more like a diamond shape than a square. In fact, an isometric box has all three primary axes (X, Y, Z) foreshortened equally. This makes it a good medium to project a three-dimensional plane in, because it does not distort like common oblique projections.
If we put a transparent plane perpendicular to your line of sight and etched the borders of the box on it the way they appear to you, that plane would allow a three-dimensional box. An isometric projection shows the X- and Y-axes to be raised 30 degrees above the lowest point.
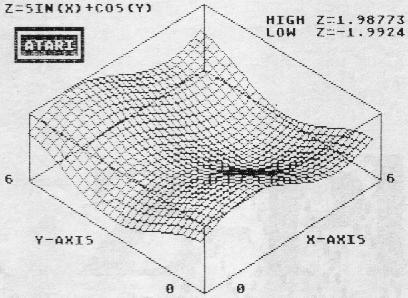
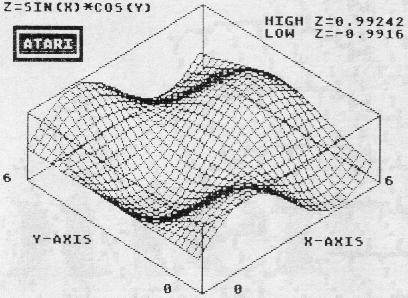
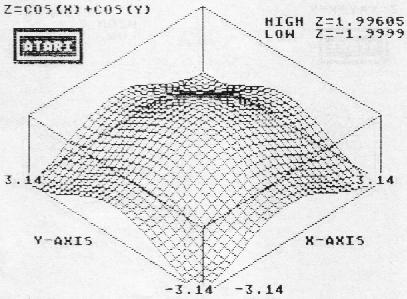
How do you plot the height (Z) of any point on the grid at any place, given its X and Y coordinates? Just use a formula such as: Z=SIN(X) + COS(Y).
Lines 10-34 - Main loop to draw lines parallel to the X-axis isometrically on the screen.
Lines 36-60 - Main loop to draw lines parallel to the Y-axis isometrically on the screen.
Lines 100-110 - Autoscale feature. These lines will determine the Z maximum and minimum values for the entered function before graphing.
Line 200 - This sound indicates that the program has finished drawing the display and is ready to perform any of the console key commands.
Lines 202-210 - This loop reads the console keys. Note: because all these console key options do not erase the screen, you can perform all of them in any order from a single run!
Lines 300-306 - 49 Second Screen Dump.
Lines 400-432 - Magniprint saving routine supplied verbatim by Magniprint on disk.
Lines 600-900 - Routine to draw isometric box over projection and label the axes.
Lines 1000-1004 - Intialize and load machine language routines. One is POKED into page 6, and the other is stored by a string.
Lines 1008-1012 - These lines provide in run entry of your formula. The actual function is entered as an input statement. The program will then create Lines 14, 40 and 104 using the forced read mode.
Lines 1013-1040 - Prompts for boundaries and screen saving name. Note: if no name is entered for screen saving, it will accept the default name, SCREEN.MP.
Line 1042 - Sets up primary variables and scaling values used in the main routine, for converting a set of (X, Y, Z) points to the 320 by 192 screen display used in graphics 24.
Line 1044 - Sets up display screen.
Lines 1100-1110 - Data for 49 Second Screen Dump.
Lines 1120-1180 - Data for the routine to superimpose text over the graphics 24 screen.
Here are some samples. Hint: rather than using powers such as X^3, BASIC will perform the configuration X*X*X much faster.
                       AUTO     Z      Z     X/Y    X/Y
FORMULA                     or
                      SCALE?  LOWER  UPPER  LOWER  UPPER
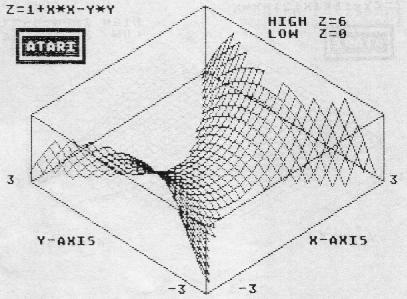
Z=1+X*X-Y*Y NO 0 6 -3 3
Z=SIN(X) YES (-1) (1) 0 6
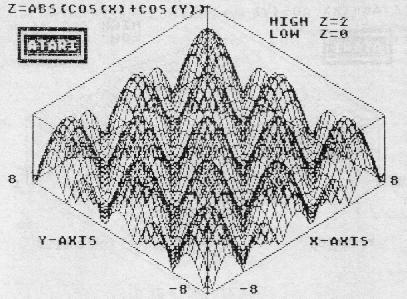
Z=SIN(X)+COS(Y) YES (-2) (2) 0 6
Z=SIN(X)*COS(Y) YES (-1) (1) 0 6
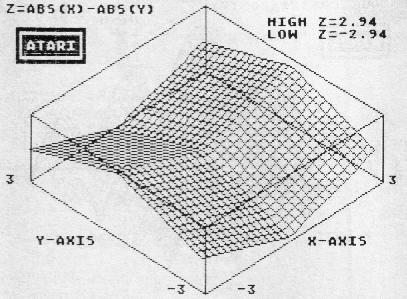
Z=ABS(X)-ABS(Y) YES - - -3 3
Z=-ABS(X)-ABS(Y) NO -3 0 -3 3
Z=(Y-1)*(X+2)*X*X NO -4 4 -3 3
Z=COS(X)*X*(Y-1) NO -3 0 -4 4
Z=X*X/1+X*X+Y*Y/1*Y*Y YES - - -4 4
Z=INT(X)+INT(Y) YES (0) (6) 0 3.9
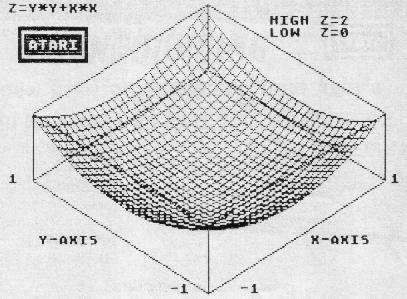
Z=X*X+Y*Y YES (2) (0) -1 1
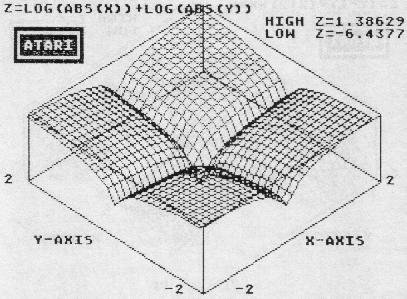
Z=LOG(ABS(X)) YES - - -2 2
+LOG(ABS(Y))
|
0 GOTO 1000 10 FOR Y=YU TO YL STEP -RES*(YU-YL):B= K0 12 FOR X=XL TO XR STEP RES*(XR-XL) 14 REM FORMULA (ENTERED DURING RUN) 16 IF Z>H OR Z<HL THEN B=K0:GOTO 34 18 XX=X*XINC 20 YY=XX*ISO 22 XX=XX-Y*YINC 24 YY=YY+Y*YINC*ISO 26 YY=YY+Z*ZINC 28 YY=191-YY-DBG 30 XX=XX+159:IF B THEN DRAWTO XX,YY:GO TO 34 32 PLOT XX,YY:B=K1 34 NEXT X:NEXT Y 36 FOR X=XL TO XR STEP RES*(XR-XL):B=K 0 38 FOR Y=YU TO YL STEP -RES*(YU-YL) 40 REM FORMULA (ENTERED DURING RUN) |
42 IF Z>H OR Z<HL THEN B=K0:GOTO 60 44 XX=X*XINC 46 YY=XX*ISO 48 XX=XX-Y*YINC 50 YY=YY+Y*YINC*ISO 52 YY=YY+Z*ZINC 54 YY=191-YY-DBG 56 XX=XX+159:IF B THEN DRAWTO XX,YY:GO TO 60 58 PLOT XX,YY:B=K1 60 NEXT Y:NEXT X:GOTO 200 100 H=K0:HL=K0:FOR Y=YU TO YL STEP -RE S*(YU-YL) 102 FOR X=XL TO XR STEP RES*(XR-XL) 104 REM FORMULA (ENTERED DURING RUN) 105 IF Z>H THEN H=Z 106 IF Z<HL THEN HL=Z 107 NEXT X:NEXT Y 108 IF HL>K0 THEN HL=K0 109 IF H<K0 THEN H=K0 110 RETURN 200 SOUND K0,100,10,14:FOR T=K0 TO 100 :NEXT T:SOUND K0,K0,K0,K0:POKE 764,255 202 S=PEEK(53279):IF S=6 THEN GOSUB 30 0:GOTO 202 204 IF S=5 THEN GOSUB 400:GOTO 202 206 IF S=3 THEN GOSUB 600:GOTO 202 208 IF PEEK(764)=28 THEN ? "$)":GOTO 1 008 210 GOTO 202 299 REM *"49 SECOND SCREEN DUMP" 300 CLOSE #5:OPEN #5,8,K0,"P:" 302 ? #5;CHR$(27);"A";CHR$(8):FOR X=DM TO DM+39 304 A$=CHR$(K0):A$(192)=A$:A$(2)=A$ 306 W=USR(1536,X,ADR(A$)):LPRINT CHR$( 27);"K";CHR$(192);CHR$(K0);A$:NEXT X:R ETURN 400 REM *400-432 IS 'AS IS' SUBROUTINE SUPPLIED BY MAGNIPRINT TO SAVE A GR.2 4SCREEN 402 RW=8:IO=K1:CLOSE #IO:OPEN #IO,RW,K 0,F$ |
404 PUT #IO,24:FOR I=704 TO 712:PUT #I
O,PEEK(I):NEXT I
406 RAMTOP=PEEK(106)*256
408 DLIST=PEEK(560)+256*PEEK(561)
410 ADDRESS=DLIST
412 NUMBER=RAMTOP-DLIST+K1
414 IO=16*IO
416 IOCB=832+IO:POKE IOCB+2,RW+3
418 ADRHI=INT(ADDRESS/256)
420 ADRLO=ADDRESS-ADRHI*256
422 POKE IOCB+4,ADRLO:POKE IOCB+5,ADRH
I
424 NUMHI=INT(NUMBER/256)
426 NUMLO=NUMBER-256*NUMHI
428 POKE IOCB+8,NUMLO:POKE IOCB+9,NUMH
I
430 I=USR(ADR(" |
900 Q=USR(ADR(Z$),D,F,ADR(Q$),LEN(Q$)) :RETURN :REM *SUB.TO ADD TEXT TO GR.24 1000 K1=1:GRAPHICS 24:RESTORE 1000:FOR T=K1 TO 61:READ Q:POKE 1535+T,Q 1001 NEXT T:DM=PEEK(88)+PEEK(89)*256:D M=DM+40*191 1002 T=K0:DIM Z$(169),Q$(40),A$(193),F $(20),FC$(40):ISO=0.523598775 1004 RESTORE 1120:FOR T=K1 TO 168:READ Q:Z$(LEN(Z$)+K1)=CHR$(Q):NEXT T 1008 POKE 82,K0:GRAPHICS K0:POKE 712,1 48:? " DAVE BADER'S ZPLOTTER! ":? " 3D ISOMETRIC PLOTTER PROGRAM ":? 1009 ? "INPUT FORMULA AS... Z=(IN TERM S OF X&Y) MAKE SURE THAT SYNTAX IS COR RECT.":? "(eg: PAIRS OF PARENTHESIS)" 1010 INPUT FC$:? " |
1026 ? :? "DESIRED RESOLUTION (1=HIGH; 10=LOW)";:INPUT RES:RES=RES+3:RES=RES* 5.0E-03 1028 F$="D:":? :? "INPUT TITLE OF SAVE D SCREEN (IF SAVED) IN MAGNIPRINT FOR MAT (8 CHARACTERS MAX)" 1030 INPUT Q$:IF Q$="" THEN F$="D:SCRE EN.MP" 1032 F$(LEN(F$)+K1)=Q$ 1035 ? :? " OPTION ADD LABELS & BORDE RS":? " SELECT SAVE IN MAGNIPRINT FOR MAT!" 1036 ? " START 49 SECOND SCREEN DUMP !" 1038 ? :? "PRESS ANY KEY TO BEGIN...": POKE 764,255 1040 IF PEEK(764)=255 THEN 1040 1041 IF T=K1 THEN ? :? " AUTO SCALIN G SEQUENCE IN ACTION!":GOSUB 100 1042 XINC=140/(XR-XL):YINC=140/(YU-YL) :ZINC=43/(H-HL):DBG=ABS(HL*ZINC)+ABS(X L*XINC*ISO)+ABS(YL*YINC*ISO) 1044 GRAPHICS 24:POKE 710,156:POKE 709 ,K0:COLOR K1:GOTO 10 1100 DATA 104,104,141,21,6,104,141,20, 6,104,141,27,6,104,141,26,6,160,193,17 3,255,255,136,240,35,141,255,255,238 1110 DATA 26,6,240,21,173,20,6,56,233, 40,141,20,6,144,4,24,76,19,6,206,21,6, 76,19,6,238,27,6,76,33,6,96 1120 DATA 104,201,4,240,9,170,240,5,10 4,104,202,208,251,96,104,133,215,104,1 33,214,104,104,168,104,133 1130 DATA 217,104,133,216,104,104,240, 236,133,212,24,165,214,101,88,133,214, 165,89,101,215,133,215,152,240,15 1140 DATA 165,214,105,64,133,214,165,2 15,105,1,133,215,136,208,241,132,221,1 60,0,132,220,177,216,160,0,170 1150 DATA 16,1,136,132,213,138,41,96,2 08,4,169,64,16,14,201,32,208,4,169,0,1 6,6,201,64,208,2 |
1160 DATA 169,32,133,218,138,41,31,5,2 18,133,218,169,0,162,3,6,218,42,202,20 8,250,109,244,2,133,219 1170 DATA 164,221,177,218,69,213,164,2 20,145,214,200,132,220,196,212,208,182 ,24,165,214,105,40,133,214,144,2 1180 DATA 230,215,230,221,169,8,197,22 1,208,159,96,207,96 |
| (see CCheck, DCheck, or UniCheck) |
|---|
0 DATA 406,678,112,865,723,946,48,418, 131,441,537,255,624,615,608,7407 38 DATA 852,859,711,940,70,440,125,435 ,531,272,646,700,318,630,774,8303 105 DATA 783,959,524,78,800,584,562,21 7,506,510,263,692,164,702,650,7994 304 DATA 801,518,565,687,912,176,213,5 63,772,680,159,434,840,363,675,8358 426 DATA 679,469,621,293,833,939,67,31 3,747,393,748,947,93,108,673,7923 1000 DATA 41,185,534,222,99,788,260,96 5,349,943,12,930,164,979,778,7249 1022 DATA 537,928,941,166,248,771,187, 35,997,841,910,266,426,553,639,8445 1120 DATA 342,204,918,307,85,956,100,2 912 |